Generating Dependency Diagrams
Sometimes it’s nice to be able to visualize the dependency structure of an application or a set of packages. I recently had a need to do this in two different contexts and found a way to automate the generation of a diagram using a few handy tools.
Background
In a post about modularizing Redux reducers and selectors, I talked about avoiding dependency cycles between the modules.
As I’ve been adding features in my current project, I’ve found that some restructuring is in order, and I wanted to make sure I wasn’t introducing dependency cycles along the way.
What I really wanted was a way to visualize the dependency structure of my Redux modules. I often use PlantUML for diagrams like this, as I discussed in an earlier post.
In this case, a component diagram seemed like just the thing.
I was going to generate the diagram by hand, searching for dependencies and writing the necessary PlantUML markup. There are Atom plugins for the PlantUML language and for previewing diagrams that make this a good option for one-off diagrams. Before going down this road, I realized that I could automate the process with a little bit of command-line glue code instead.
If you want to try this at home, you’ll want to make sure you have PlantUML installed. I install it via homebrew on OS/X (brew install plantuml), which comes with a handy shell script for running it. On other platforms, you may have to download the .jar file from the website and run it by hand with java -jar /path/to/plantuml.jar instead.
After hacking something together on the command-line, I decided that I wanted to be able to do this at any time, so I cleaned it up and added a bash script to my project, along with an npm script to run it. Now I can run yarn diagram at any time to see the current dependency structure of my application.
Visualizing Redux Module Dependencies
Here’s the script I came up with. I learned how to write shell scripts in this style by watching Gary Bernhardt’s excellent Destroy All Software screencasts (the Classic episodes).
#!/bin/bash
 SRC="src"
MODULES="modules"
OUTPUT="docs/modules.png"
 main() {
  generateDiagram $OUTPUT && open $OUTPUT
}
 generateDiagram() {
  files=$(findFiles)
   findImports $files |
    stripLeadingDirectories |
    generatePlantuml |
    removeDuplicates |
    createDiagram > $1
}
 findFiles() {
  find $SRC -name '*.js'
}
 findImports() {
  grep -e "^import.* from '${MODULES}/.*'" $@
}
 stripLeadingDirectories() {
  sed -E "s/^${SRC}\/(${MODULES}\/)?//"
}
 generatePlantuml() {
  sed -E "s/^([^/]+)[^:]*:import.*from '${MODULES}\/([^/]+).*'$/[\1] --> [\2]/"
}
 removeDuplicates() {
  sort | uniq
}
 createDiagram() {
  plantuml -pipe
}
 main
I’ve extracted some variables at the top to make it easy to adapt to other projects that use different directory names.
Here’s how it works:
-
Use
findto find all of my JavaScript source files (infindFiles). -
Find all of the ES6
importstatements that import from a module usinggrep(infindImports). -
Strip off the leading directories so that the first part of each line is the name of the importing directory using
sed(instripLeadingDirectories). At this step,src/modules/foo...becomesfoo.... In my application, there’s abasedirectory that holds the top-level Redux setup like the main reducer andconfigureStorefunction, and I want that to appear in my diagram so the regex allows for that. This could probably be combined with the next step, but I didn’t spend time to figure that out; this was easier to understand at the time. -
Generate the PlantUML output, again using
sed(ingenerate_plantuml). In a PlantUML component diagram, each component name is surrounded with square brackets ([component]) and a dependency is represented by-->. So, I need to generate one line for every import, each of the form[foo] --> [bar]. The regex is a bit hairy, but basically it finds the name of the importing module and the name of the module being imported, and substitutes those into the correct output format. -
Remove duplicate entries using
sortanduniq(inremoveDuplicates).uniqonly removes adjacent unique entries, so I firstsortthem to ensure that the duplicates are next to each other. -
Send the result through
plantumlto produce the diagram (increateDiagram). -
Redirect the output to a file.
-
Finally,
openthe resulting diagram.
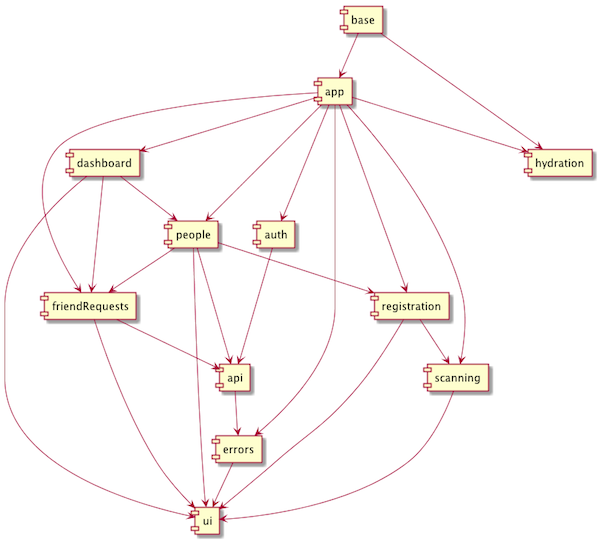
Here’s the result when the application is in good shape. This is the actual diagram from an earlier, anonymized version of my current project.

Finding Dependency Cycles
When everything is fine, all of the arrows in the diagram will be pointing down. Anything pointing back up the diagram or circling on itself is a problem.
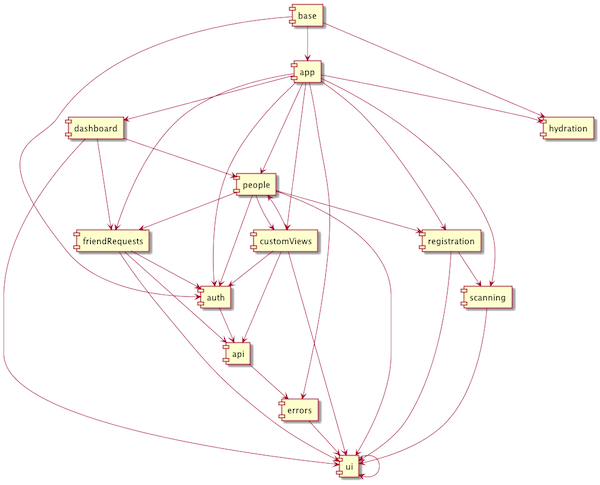
Here’s a diagram that shows such problems. This is what I saw in the middle of one of my refactorings.

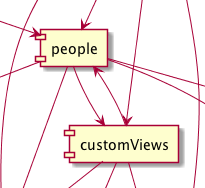
This diagram shows two problems. First, there is a circular dependency between people and customViews.

Also, there is a self-dependency in the ui module.

This can happen when you accidentally import from a module from within itself:
// in src/modules/ui/components/Heading/index.js
 import { Label } from 'modules/ui'
When I see one of these problems in a diagram, I know I’ve got some work to do to fix the problems.
Self-dependencies are relatively easy to fix. The above example should be written as:
// in src/modules/ui/components/Heading/index.js
 import { Label } from '../Label'
Actual dependency cycles are harder to break, and a deep discussion of this is beyond the scope of this post. But I will repeat my advice from my earlier post:
The “textbook” way of dealing with ADP violations (where the textbook is Uncle Bob’s Agile Software Development: Principles, Patterns, and Practices) is to break the dependency cycle using one of two mechanisms:
Apply the Dependency Inversion Principle. We’d have to extract something within
todosthat could be used by bothappandtodosto break the cycle. We’ll see an example of this in the next section.Create a new module that both
appandtodosdepend on.
Ruby Gem Dependencies
In another situation, I needed to visualize the dependency structure between a family of local Ruby gems.
The script for generating the diagram was very similar to the one shown above, but I did it as a one-off on the command-line. I first checked out the source code for each of the gems into a directory. Then, I ran the following code (broken up onto multiple lines to make it easier to follow):
grep dependency */*.gemspec |
  sed -E 's/([^/]+).*_dependency[^"]*"([^"]+).*/[\1] --> [\2]/' |
  sort | uniq |
  plantuml -pipe > ~/tmp/gems.png
The only differences from the above script are the file pattern passed to grep, the lack of a step to strip leading directory names, and the regex used to generate the PlantUML syntax.
Conclusion
PlantUML is a great tool for visualizing project structure, and with a bit of command-line resourcefulness, it is possible to generate the diagrams automatically. Give it a try on your project and see what you learn.