Finding Memory Leaks in Visualworks Smalltalk
When working on an application in Visualworks Smalltalk, you might find that memory use continues to increase over time. Yes, even in a garbage collected language, memory leaks are a possibility.
Visualworks comes with the Class Report tool which can be used to track down memory leaks. I’ve used it several times to figure out memory usage problems in my applications. The Class Report tool is part of the Advanced Tools Suite.
The following workflow works well for me:
-
Load the
AT System Analysisparcel using the Parcel Manager (Directoriestab, then selectadvanced). -
Choose
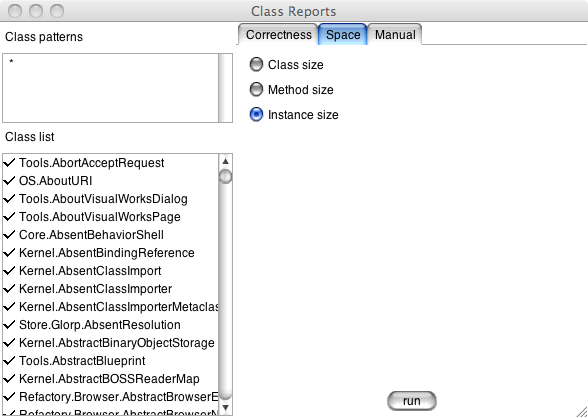
Tools | Advanced | Class reportsfrom the Launcher. -
Right-click in the Class list and choose
Add all. -
Choose the
Spacetab on the right, and select theInstance sizeoption. -
Click the
runbutton.

- In the report window that pops up, use
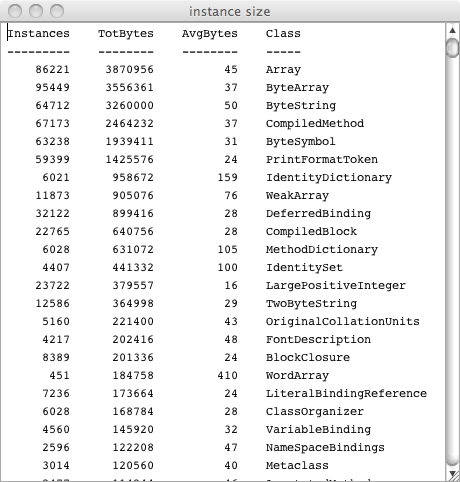
Ctrl-Ato select all of the text, then copy and paste it to a text editor and save it asbefore.txt. It helps to delete the header and footer lines, leaving just the actual list of classes.

-
Close the report window, but leave the Class Reports tool open.
-
Run your application or a set of tests that expose the memory leak.
-
Click the
runbutton in the Class Reports window again. Save this report asafter.txt. -
The class report is sorted by total instance size, which makes it hard to see differences. Sorting by class name keeps everything in the same place before and after. On a Unix-like system (Linux, OS/X, Cygwin, etc.), do the following:
sort -k 4 before.txt > before-sorted.txt
sort -k 4 after.txt > after-sorted.txt
diff before-sorted.txt after-sorted.txt
You can use a graphical diff tool in place of the command-line diff above. I’ve used Meld on Linux and KDiff3 on MacOS/X.
- Look through the differences to find the cause of the memory leak. Often, the root cause will be a single instance of a high-level class that hangs onto an entire tree of many other objects. Finding a way to ensure that this object gets garbage-collected goes a long way to solving memory problems. I often find that I’ve forgotten to unsubscribe an observer at a strategic location that leaves me with a reference cycle that the garbage collector can’t break.
I hope you find this tool helpful in your debugging efforts.
Thanks to Karsten Kusche who mentioned the Class Report tool on the VWNC mailing list a few years ago.